17 Nov, 2026

Our November analysis of the Q2 Relationship Insights commercial loan and deposit pricing database looks at October 2026 activity, the first full month after the Federal Reserve's September rate hike. Pricing volume held steady and coupons moved higher, leaving the average coupon on all three structures we track above 6% for the first time this year.
Beneath those higher coupons, the story split by structure. Floating-rate pricing picked up both spread and margin, while fixed-rate spreads slipped to a new low as funding costs outran coupon gains. At the same time, deposit rates and liquidity costs, two levers that bankers and pricing managers control more directly, both moved higher.
Market rates also moved quickly enough that a month-end snapshot told only part of the story, so this month we added a more current look at the funding curve.
Read on for more details.
Data Notes
- When we discuss the cost of funds (COF) on loan pricing activity, we refer to the marginal, duration-matched funding cost employed in pricing, not the bank's actual average (historical) cost of funds
- We define Regional+ as institutions with $8B+ in assets, while Community are <$8B
Volume: Steady after September's rebound
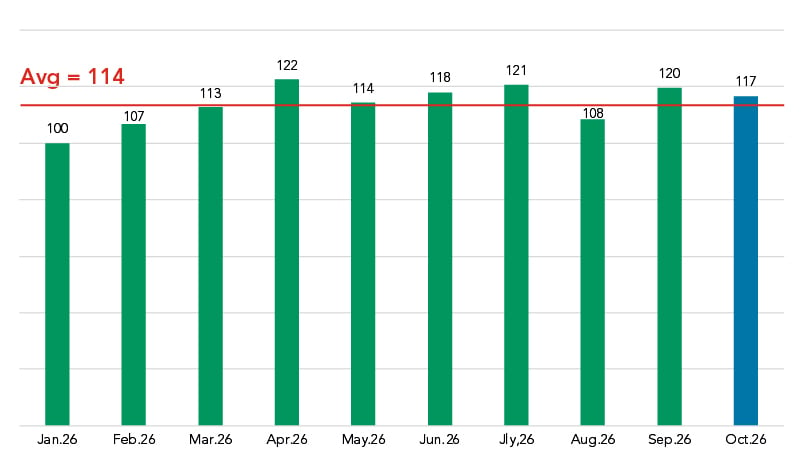
October pricing activity was nearly equivalent to September's, slipping about 2% on the month. Volume remained above the 10-month average of 114.
Priced Commercial Loan Volume, Indexed to January 2026=100
Spreads: SOFR rebounds while fixed sets a new low
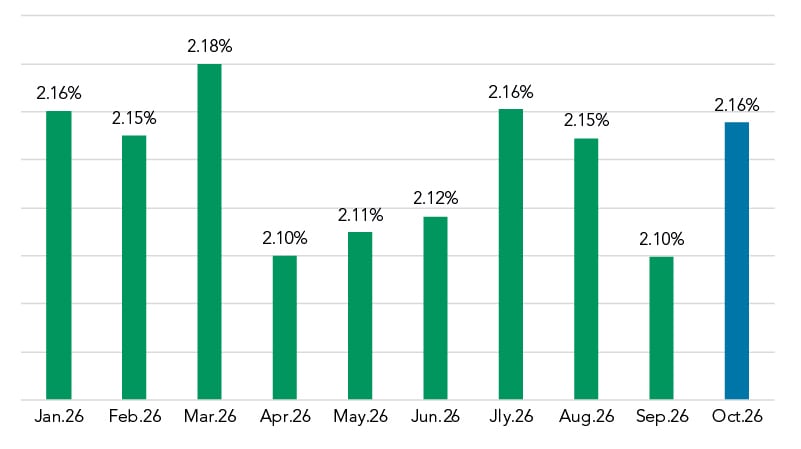
SOFR spreads rose 6 basis points (2.10% to 2.16%), returning to the high end of the range they have traded in all year. That range is narrow, spanning only about 8 bps in 2026, so month-to-month moves here should be kept in perspective.
Weighted Average Spread to SOFR
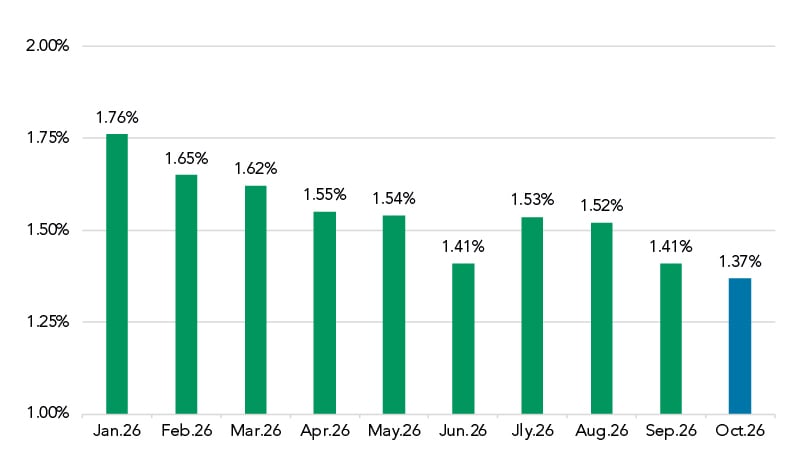
Fixed-rate spreads tell a different story. The fixed-rate coupon over COF fell 4 bps (from 1.41% to 1.37%), its lowest point of the year and a decline of nearly 40 bps since January. Even during the period when the funding curve was inverted, this measure never fell to that level. In fact, 1.37% is the lowest it has been in almost four years of reporting.
Fixed-Rate Coupon Over COF
Fixed-rate coupons have proven less responsive to changes in market rates than SOFR counterparts. Because fixed-rate loans carry a variety of many maturity-based market reference rates, the month-over-month change in coupon is less clear than for SOFR or prime loans. In sum, we can observe a relative decrease in value as measured by spread to the corresponding reference rates.
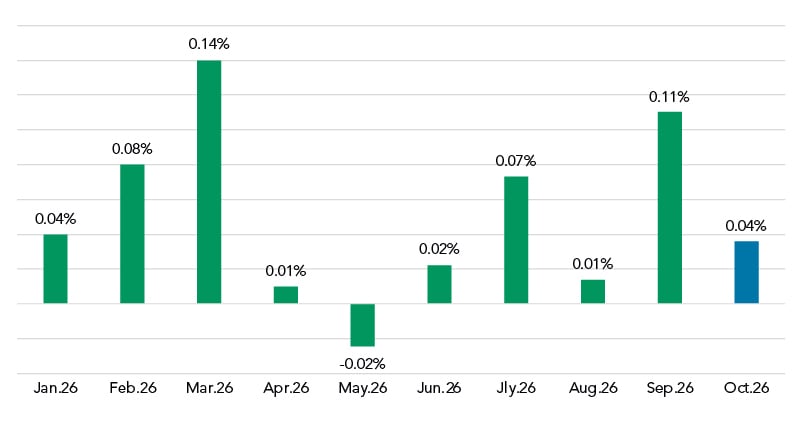
Prime spreads fell 7 bps (from 0.11% to 0.04%) but remain within their usual narrow range.
Weighted Average Spread to Prime
Coupons: All three structures now above 6%
Coupons moved higher in October. The fixed-rate coupon rose 13 bps (6.43% to 6.56%), and the SOFR coupon rose 15 bps (from 5.93% to 6.08%). The prime coupon was essentially flat (7.00% to 6.98%). The contrast with the start of the year is striking: in January, fixed and SOFR coupons were at near parity (5.86% and 5.84%). They now sit 48 bps apart.
Coupon Rate by Month, Rolling Trend
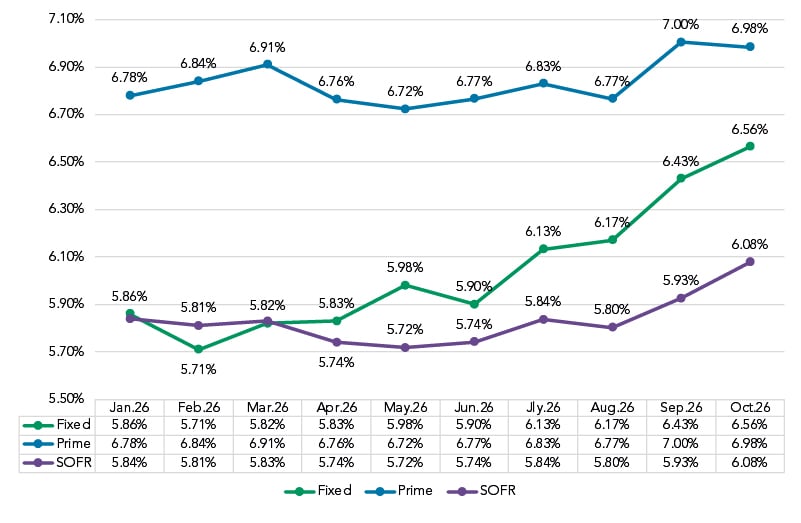
Because the Fed's 25-basis-point hike came mid-month on September 18, the clearest view comes from comparing August to October. Over that span, the SOFR coupon rose 28 bps (5.80% to 6.08%), largely reflecting the change in the index. The fixed-rate coupon rose 39 bps (6.17% to 6.56%), outpacing the 30 bps increase (4.62% to 4.92%) in the 60-month point of the funding curve over the same period. As the next section shows, however, that gain did not keep pace with fixed-rate funding costs.
Cost of funds: Fixed-rate costs outrun coupon gains
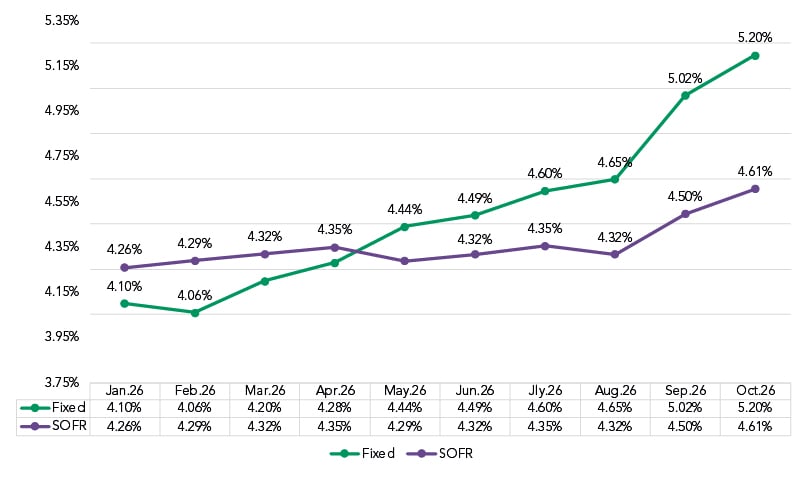
Fixed-rate COF rose 18 bps (5.02% to 5.20%) in October and is up 55 bps (4.65% to 5.20%) since August. Set against the 39 bps coupon increase over the same period, that gap accounts for much of the decline in fixed-rate spreads.
SOFR COF rose 11 bps (4.50% to 4.61%) in October and 29 bps (4.32% to 4.61%) since August, consistent with the 25 bps rate hike plus a modest increase in liquidity costs.
All-In COF by Month, Rolling Trend
NIM: SOFR gains, fixed holds steady
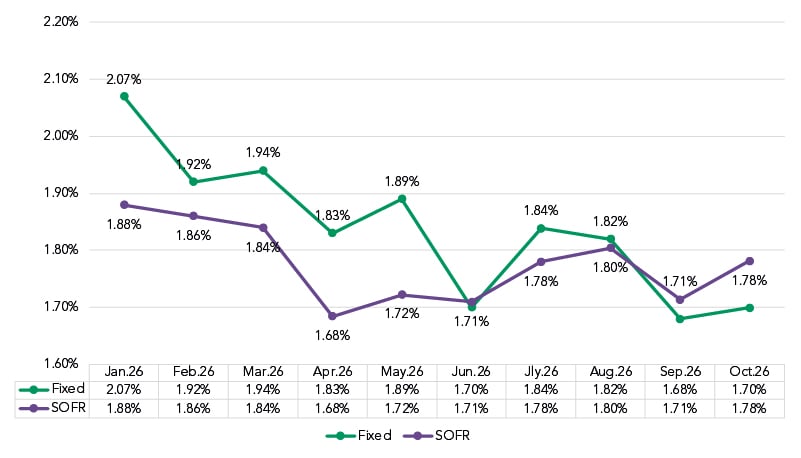
SOFR net interest margin (NIM) rose 7 bps (1.71% to 1.78%), driven by the uptick in spread. Fixed-rate NIM edged up 2 bps (1.68% to 1.70%) despite the lower spread over COF, driven by a 2 bps increase in net origination fees. It remains 12 bps below its August level of 1.82%.
Net Interest Margin by Month, Rolling Trend
Funding curve: October eases, then snaps back
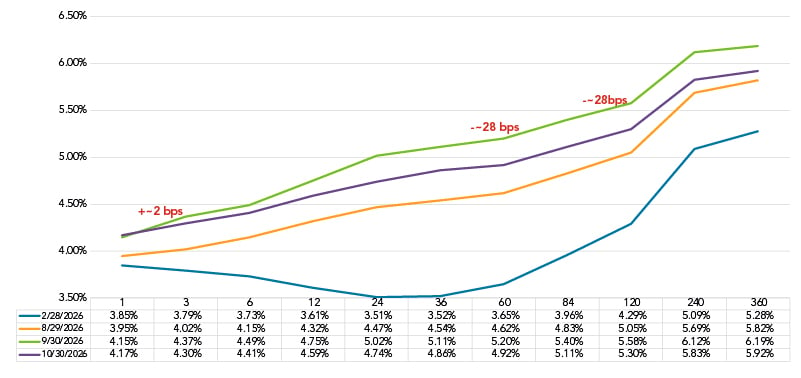
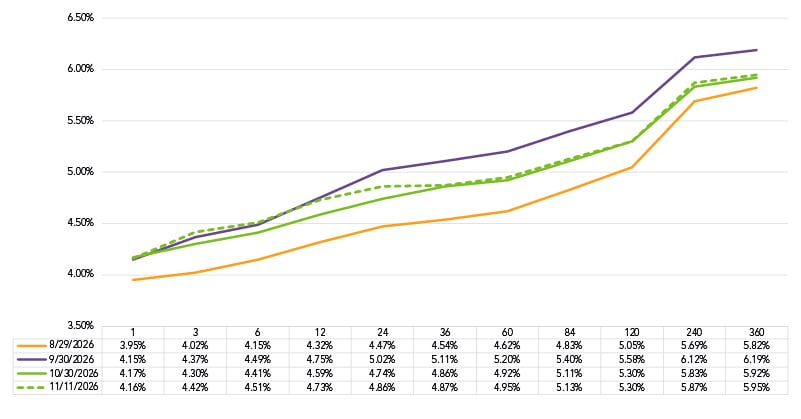
Between the September 30 and October 30 snapshots, the longer end of the curve eased. The 60-month rate fell 28 bps (5.20% to 4.92%), and the 120-month rate also fell 28 bps (5.58% to 5.30%), while the one-month rate was nearly unchanged (+2 bps). The end-of-October curve sits roughly midway between the late-August and late-September curves.
Relationship Insights All-In Marginal Funding Curve
Much has also happened since October 30, so we added a November 11 snapshot. Short- and mid-tenor rates had already moved back up, with the 12-month rate rising 14 bps (4.59% to 4.73%) and the 24-month rate rising 12 bps (4.74% to 4.86%). The 60-month rate was little changed (4.92% to 4.95%), but some of October's easing has already reversed.
Relationship Insights All-In Marginal Funding Curve, Current Snapshot
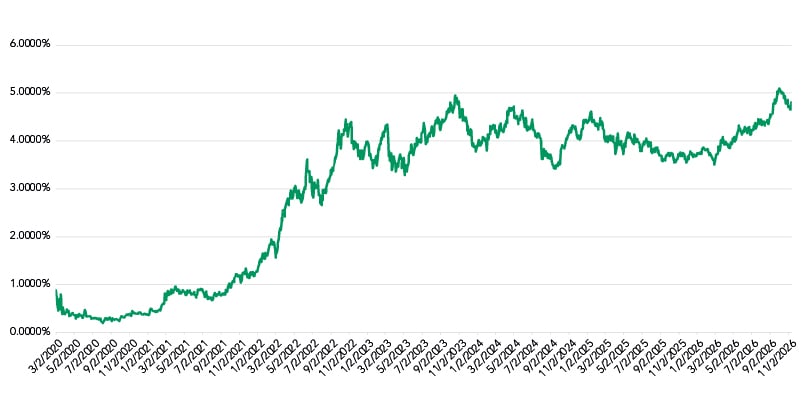
That creates an apparent disconnect. Month-end market rates were lower, yet fixed-rate COF in October pricing activity was higher. Part of the explanation is timing. COF reflects pricing activity across the month, not a single snapshot, and funding costs tend to lag market rates. The 60-month Treasury reached 5.09% on October 1, the highest point on our chart going back to early 2020, and hovered around 5% into mid-October before easing.
60-Month Treasury Since March 2020
The speed of these moves may also be a factor. With FHLB curve data no longer publicly available, many Q2 Relationship Insights institutions maintain their own custom funding curves, updated daily or weekly and often manually. In a market moving this quickly, pricing practices may have difficulty keeping pace, and we'll be watching closely to see where funding costs settle.
Liquidity costs: Short end moves higher
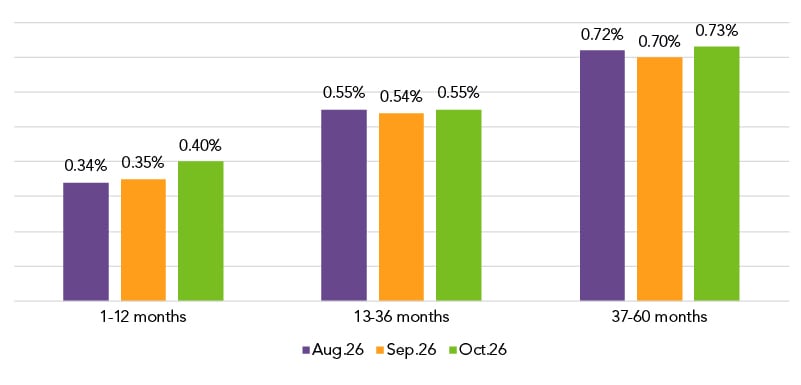
Liquidity costs remained at the high end of their range in October. The most notable move came at the short end, where costs on one- to 12-month maturities rose 5 bps (from 35 bps to 40 bps). That may sound modest, but this bucket covers a large share of pricing volume, including nearly every line of credit. It's also worth noting that short-term market rates barely moved during the month.
Costs on longer maturities were steadier, rising 1 bp (54 bps to 55 bps) on 13- to 36-month maturities and 3 bps (70 bps to 73 bps) on 37- to 60-month maturities.
Implied Liquidity Cost by Loan Maturity Stratification, Pricing Activity by Month
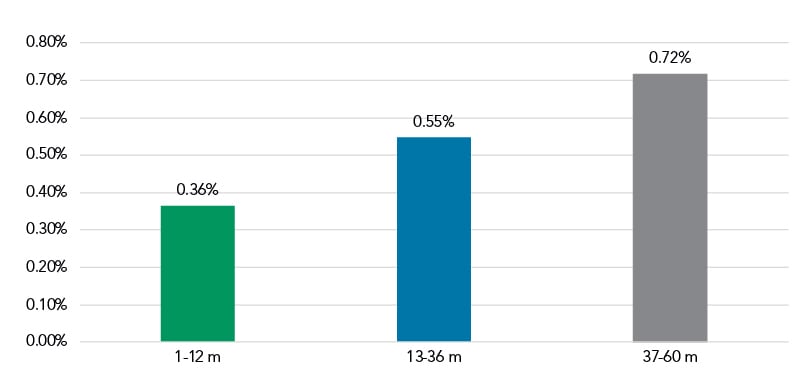
Implied Liquidity Cost by Loan Maturity Stratification, Pricing activity last 90 days
Deposits: Regional+ rates rise again, Community holds
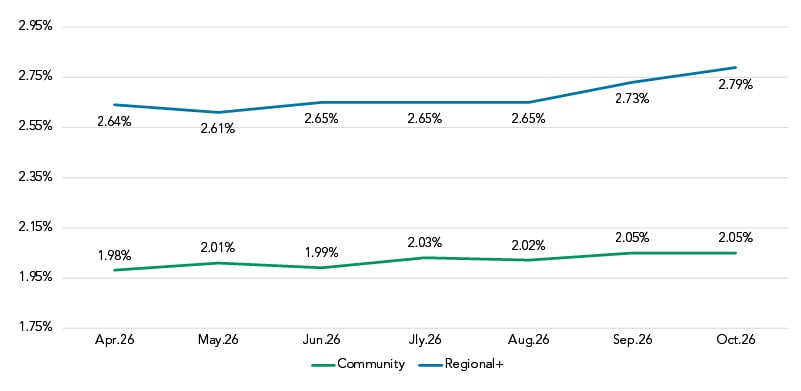
Interest-bearing non-time deposit rates, our proxy for management-set deposit pricing, moved higher again in the Regional+ segment. Rates rose 6 bps (2.73% to 2.79%) in October, following an 8 bps increase in September, for a total gain of 14 bps (2.65% to 2.79%) since August.
Community rates, by contrast, were flat at 2.05% in October and are up just 3 bps since August. Through most of 2026, the two segments operated at different levels but moved roughly in parallel. Since the rate hike, they have diverged. Taken together with rising liquidity costs, the Regional+ increases may suggest those institutions are preparing for further funding pressure. It will be interesting to see whether Community institutions follow in the months ahead.
Interest-Bearing Non-Time (MMDA, CWI, Savings) Rate Paid
Got questions?
Our banking consultants and data scientists are combing through Q2 Relationship Insights pricing data every day. If there is anything you'd like to know about what they're seeing, please send your questions to insights@q2.com.