16 Dec, 2025

Our December analysis of Q2 PrecisionLender commercial loan pricing focused on November activity in the wake of the late-October Fed rate cut. There were signs of a typical seasonal slowdown, while spreads posted mixed results and deposit rates continued to fall.
The story got a bit more interesting though, when we drilled down another level and looked at what was happening in the community banking segment. Pricing volumes stepped down from October in a way that looks very similar to the typical seasonal slowdown we see as the holidays approach. Even so, the second half of 2025 remains stronger than the first half from a pricing-volume standpoint.
Read on for more details.
Data Notes:
• When we discuss the cost of funds (COF) on loan pricing activity, we refer to the marginal duration matched funding cost employed in pricing, not the bank’s actual average (historical) cost of funds.
• We define Regional+ as institutions with $8B+ in assets, while Community are <$8B.
Season slowdown, but 2H volume still outpaces 1H
November loan pricing activity stepped down from October, but it did so in a very familiar way. Total pricing volume declined by 18% month over month, a decrease that closely mirrors last year’s October-to-November drop as the market slows heading into year-end.
Despite that pullback, overall activity remains elevated when compared to the start of the year. Through November, second-half 2025 pricing volume is running roughly 10% above the first half, consistent with a pattern we often see: a relatively quiet Q1, followed by stronger activity in the middle of the year, and then a seasonal slowdown toward the holidays.
Commercial Loan Pricing Volume
Indexed to January 2025 = 100

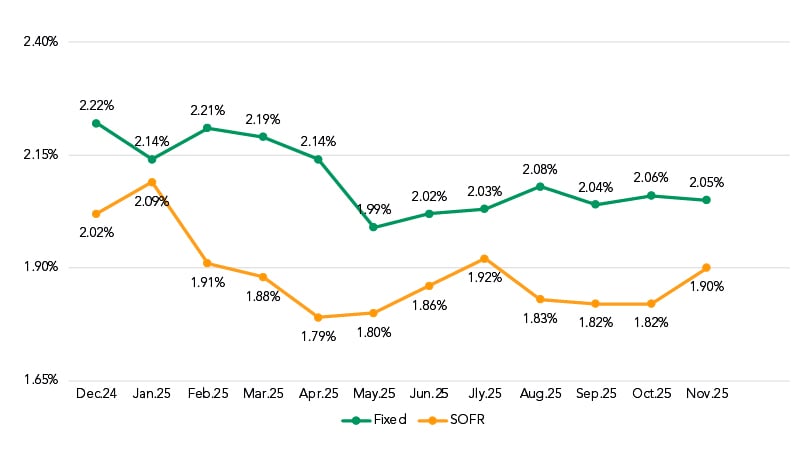
SOFR-based loans make NIM gains
While NIM on fixed-rate loans remained essentially flat for the third straight month, it rose by eight basis points (bps) on SOFR-based loans (1.82% to 1.90%). This was the largest single-month increase in SOFR NIM in the past 12 months, ahead of the 7-point increase from December 2024 to January 2025.
Both SOFR and fixed-rate NIM remain at lower levels than Q1 2025, a drop that's been driven by the downward slide in revenue.
NIM by Month
Rolling Trend
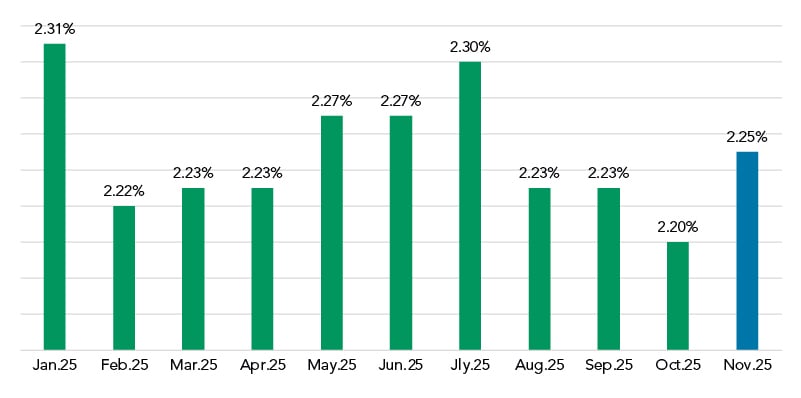
Spreads produce mixed results
The NIM improvement for SOFR-based floating-rate loans was driven primarily by spread as this metric improved by 5 bps from October (2.20%) to November (2.25%).
Weighted Average Spread to SOFR
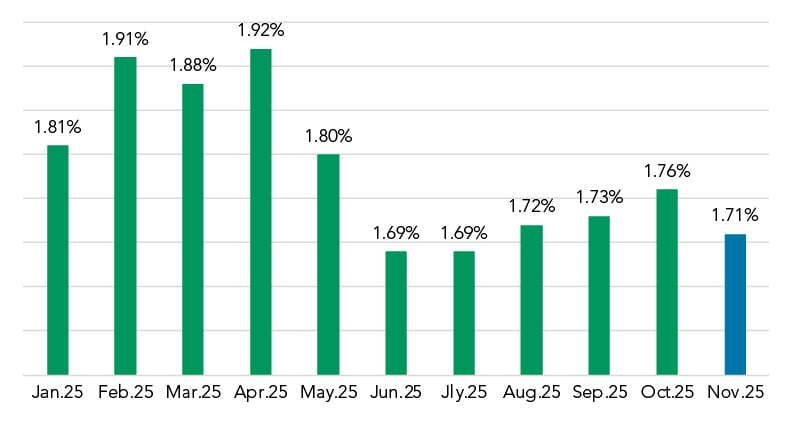
It was a different story for the fixed-rate spreads, which fell by 5 bps month over month. (1.76% to 1.71%).
Fixed Rate Coupon Over COF
Spreads to Prime also fell, dropping from 0.15% down to 0.03%, near the bottom of the range in 2025 for this metric.
Weighted Average Spread to Prime

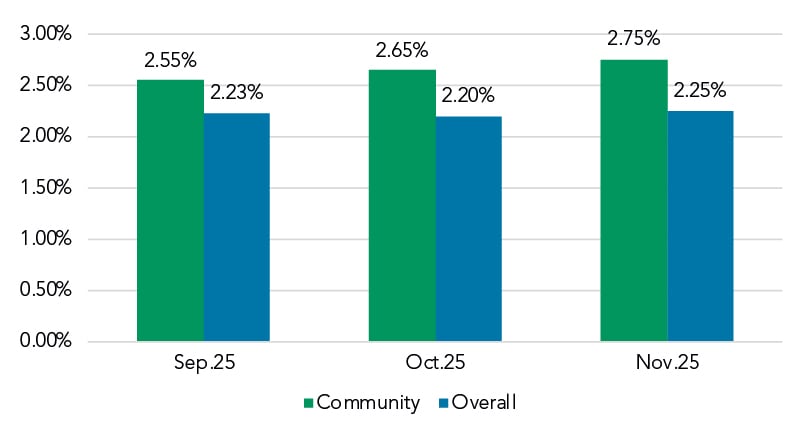
The spread story shifts at the segment level
When we drilled a bit deeper on the spread data, we found some interesting developments in the Community segment.
Community bankers slightly outperformed the rest of the market when it came to SOFR spreads, adding 10 bps month over month (2.65% to 2.75%) compared to the overall increase of 5 bps. Over the past three months, SOFR spreads have increased by 20 bps (2.55 to 2.75%) while remaining essentially flat overall (2.23% in September vs 2.25% in November).
Weight Average Spread to SOFR
Community vs. Overall
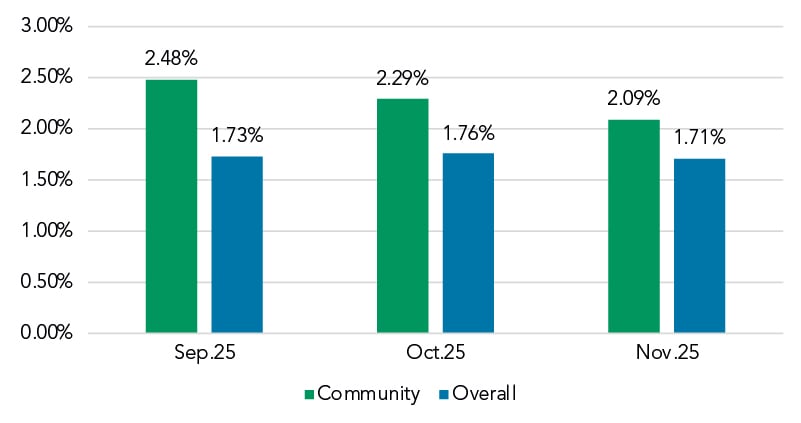
It was a different story though, for fixed-rate spreads. They fell by 20 basis points in November (2.29% to 2.09%) in the Community segment, compared to the 5 bps drop in the overall market. Cumulatively the fixed-rate coupon over COF has fallen by 39 bps over the past three months in the Community segment (2.48% to 2.09%), compared to just a 2 bps drop (1.73% to 1.71%) in the overall market. The slip in community spreads is curious as it’s unclear what the driving force is behind it.
Fixed-Rate Coupon Over COF
Community vs. Overall
All in funding costs contrast with FHLB curve
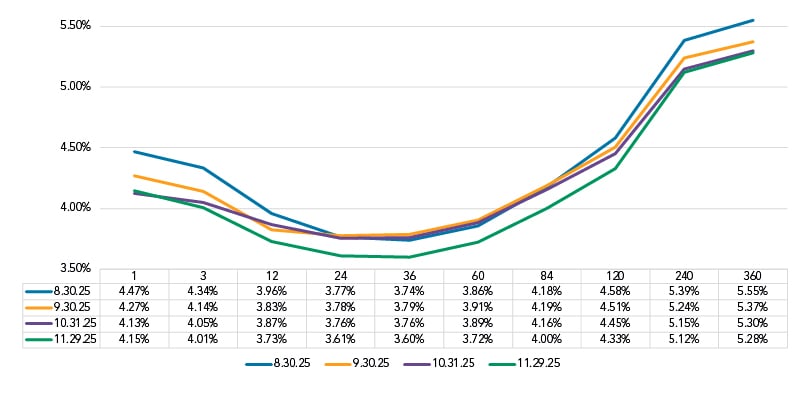
With that drop in fixed-rate spreads in mind, we looked next at the FHLB curve. While it was relatively stable month over month at the 1-month point (the basis for floating-rate loans), the inversion deepened from there, with rates dropping across the board. The bottom of the trough was at ~ the 36-month point, which was 55 points below the 1-month mark for the Nov. 29 snapshot.
FHLB Curve
Selected Dates
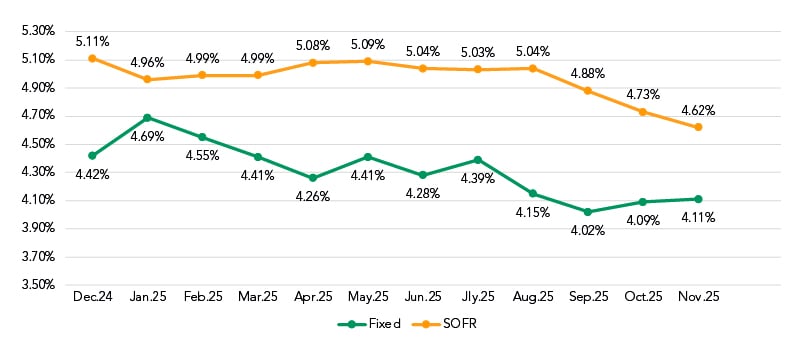
The movement of the FHLB curve was in contrast to all in funding costs in November. SOFR COF fell by 11 bps (4.73% to 4.62%). Note the difference here is explained in part because many institutions use a SOFR curve to assign COF, instead of the FHLB curve.
It was different sort of contrast when it came to fixed-rate COF. Though the 60-month mark on the FHLB curve (the typical proxy for fixed-rate funding costs) fell by 17 bps from Oct. 31 to the Nov. 29 snapshot, the funding costs that bankers used in their pricing in November actually rose by 2 bps, from 4.09% to 4.11%.
All in COF by Month
Rolling Trend
Coupons are steady, but not in the Community segment
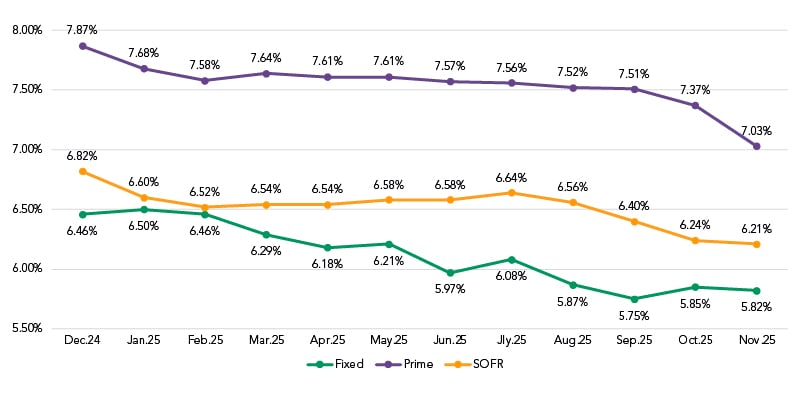
SOFR coupons fell 3 bps (6.24% to 6.21%) as the drop in index values was only partially offset by the increase in spreads.
The drop in the Prime index and the drop in spreads combined to pull Prime coupons down 34 bps in November (7.37% to 7.03%).
With the spread for fixed-rate loans down by 5 bps in November and funding costs up by 2 bps during that period, it followed that the fixed-rate coupon dropped by 3 bps as well (from 5.85% to 5.82%
Coupon Rate by Month
Rolling Trend
As with spreads, the fixed-rate coupon story shifted considerably when we looked at the Community segment.
There, the fixed-rate coupon fell by 22 bps in November, compared to the 3 bps drop in the overall market. Over the past three months, the fixed-rate coupon has dropped by 40 bps (6.39% to 6.09%), while it has risen by 7 bps (5.75% to 5.82%) in the overall market.
Fixed-Rate Coupon
Community vs. Overall

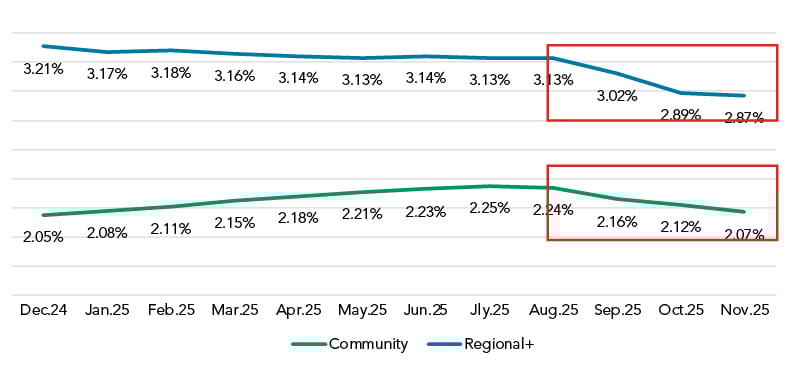
Deposit rates continue to drop
Finally, we checked in again on deposits. To measure the cumulative rate change and monthly incremental changes, we looked at interest-bearing non-time portfolios as a proxy for bank management set rates. Interest-bearing non-time rates have dropped by 26 bps since August in the Regional+ segment (3.13% to 2.87%) and by 17 bps in that same three-month period in the Community segment (2.24% to 2.07%).
That’s expected on the heels of the September and October Fed rate cuts that totaled 50 bps. What’s worth noting though, is that these deposit rates are falling slower, down 17 bps, than the revenue measures for fixed-rate loans in the Community segment. Since August, coupons in that segment have dropped by 40 bps.
Interest Bearing Non-Time (MMDA, CWI, Savings) Rate Paid
Got questions?
Our banking consultants and data scientists are combing through Q2 PrecisionLender pricing data every day. If there is anything you’d like to know about what they’re seeing, please send your questions to insights@q2.com.