20 Jul, 2026

Our July analysis of the Q2 PrecisionLender commercial loan pricing database takes a mid-year look at coupon trends for both fixed- and floating-rate structures, against a backdrop of continued funding curve steepening and another month of sharp NIM compression. We also check in on how community institutions are faring relative to the broader market.
Read on for more details.
Data Notes
• When we discuss the cost of funds (COF) on loan pricing activity, we refer to the marginal, duration-matched funding cost employed in pricing, not the bank's actual average (historical) cost of funds.
• We define Regional+ as institutions with $8B+ in assets, while Community are <$8B.
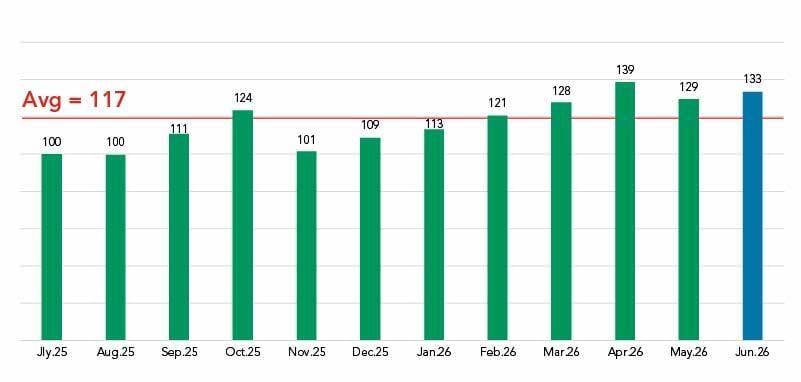
Volume: Edging upward through mid-year, led by Regional+
Mid-year coupon check: SOFR loses ground, fixed erratic
With the first half of 2026 now behind us, it is worth stepping back from the monthly data to look at the coupon picture in full.
The SOFR coupon was essentially flat through the first quarter but has given up ground in the second, dropping from 5.83% in March to 5.74% in June.
The fixed-rate coupon tells a different story, one of inconsistency. There have been months in which fixed-rate pricing moved higher in step with market rates, and months where it did not. The result, from January (5.86%) to June (5.90%, is more of an erratic pattern, than a meaningful trend in either direction. It was as low at 5.71% in February, then as high as 5.98% in May.
Coupon Rate by Month
Rolling Trend
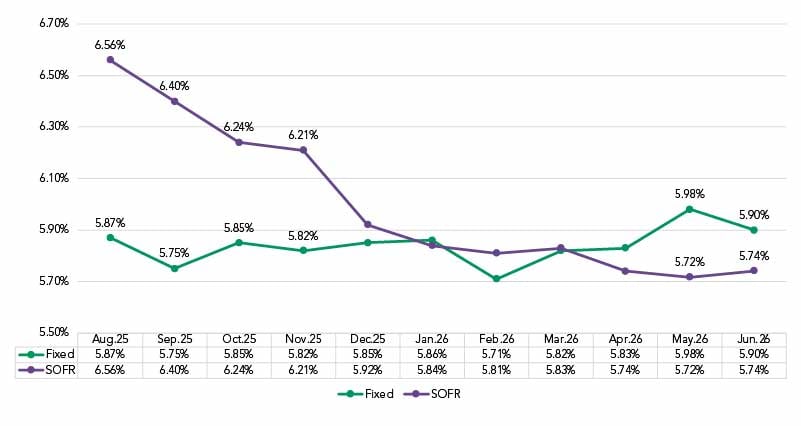
In April, the fixed-rate coupon moved above the SOFR coupon, but in June that gap narrowed from 26 bps to 16 (5.90% to 5.74%). Whether that reflects a one-month anomaly or the beginning of a new move closer to parity is something we will continue to watch.
Spreads: Fixed rate takes a hit while SOFR and Prime hold steady
The spread picture in June drew a sharp line between floating- and fixed-rate structures. SOFR spreads were essentially unchanged on the month, moving up 1 bp (2.11% to 2.12%), while the Spread to Prime made a small move upward into positive territory over the index (-0.02% to 0.02%). The fixed-rate story was different.
Weighted Average Spread to SOFR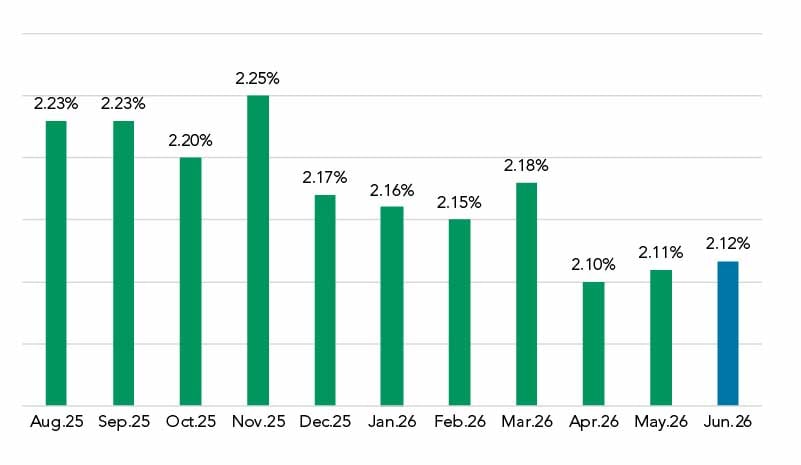
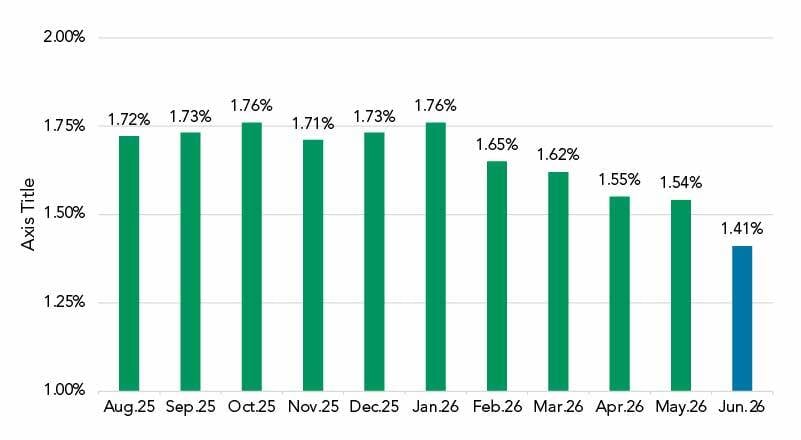
The fixed-rate coupon spread over cost of funds dropped sharply in June, falling 13 bps, from 1.54% to 1.41%. It was the third month-to-month noteworthy drop in 2026, along 11 bps from January (1.76%) to February (1.65%) and 7 bps from March (1.62%) to April (1.55%). Overall, the fixed-rate coupon spread over COF has dropped 35 bps since January. As a reminder, fixed-rate structures comprise ~20-25% of pricing volume.
Fixed-Rate Coupon Over COF
Funding Curve: Selective steepening continues into June
The PrecisionLender all-in marginal funding curve steepened again in June, but the move was not uniform across the term structure. The 1- to 12-month segment added slope again relative to May, with the 12-month rate at the June 30 snapshot 17 bps higher than the May 29 snapshot (4.14% vs. 3.97%). Meanwhile the 60-month rate was roughly flat from May 29 (4.29%) to June 30 (4.28%). The 120-month rate dropped by 7 bps (from 4.77% to 4.70%) across those snapshots.
PrecisionLender All-In Marginal Funding Curve
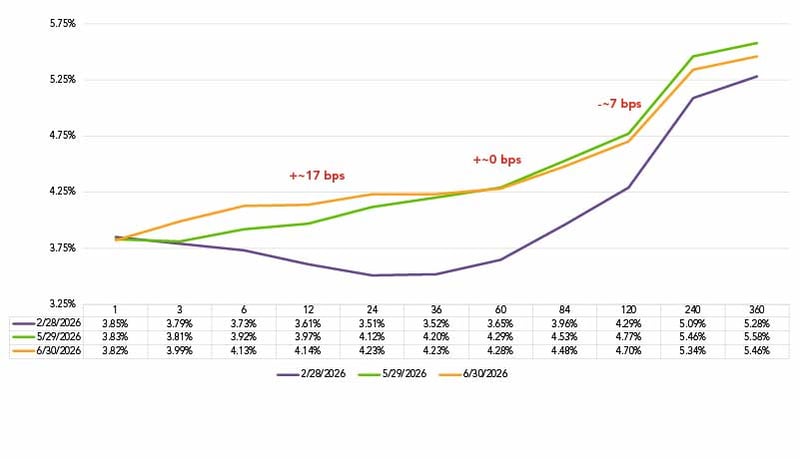
It’s worth noting though, that while the month-end reading showed little change for the 60-month term, the average rate over the course of June was approximately 7 bps higher than the month-end snapshot (4.35% average versus 4.28% on June 30). Those higher intra- month data points brought fixed rate COF upward for June overall.
The short-to-mid portion of the curve continues to add slope in June, while the longer end did not follow suit.
Fixed-Rate Cost of Funds and NIM: Rising costs, falling margins
Fixed-rate funding costs were up roughly 5 bps (4.44% to 4.49%), a move largely explained by the intra-month curve movement at the 60-month point. SOFR funding costs rose 3 bps (4.29% to 4.32%) and are up 6 bps since January.
All-In COF by Month
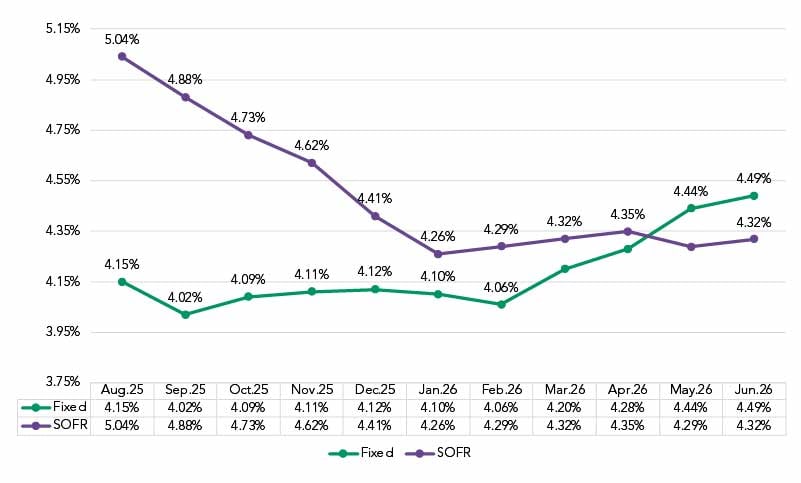
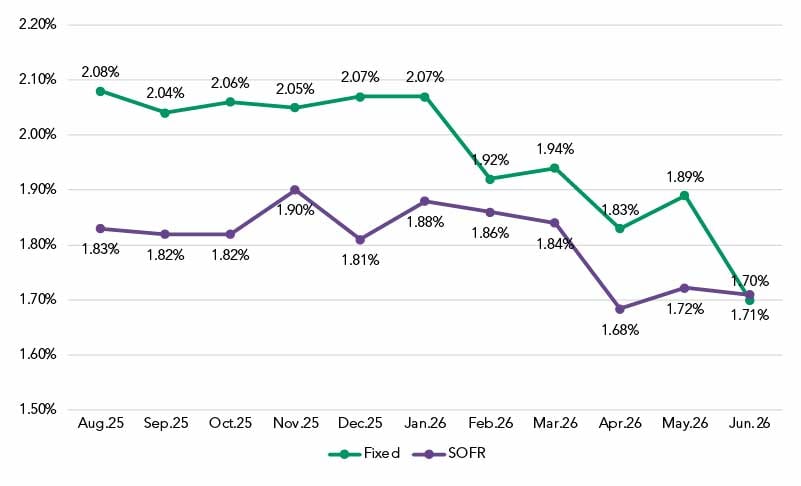
The combination of rising funding costs and coupons that are not keeping pace produced a predictable result for fixed-rate structure—significant margin compression. Fixed-rate NIM fell sharply in June, from 1.89% to 1.70%. The coupon picture described earlier is central to understanding why. When coupons and net fee income drift lower or stay flat in a rising marginal-cost environment, NIM often suffers and signals the downshift in marginal profitability measures.
NIM by Month
Rolling Trend
Community Corner: Holding onto fixed-rate revenue better than the overall market
We decided to see whether this coupon story was the same for the community banking segment. We found that community banks are continuing to price a revenue premium across structures, consistent with what we have seen in previous Community Corner updates.
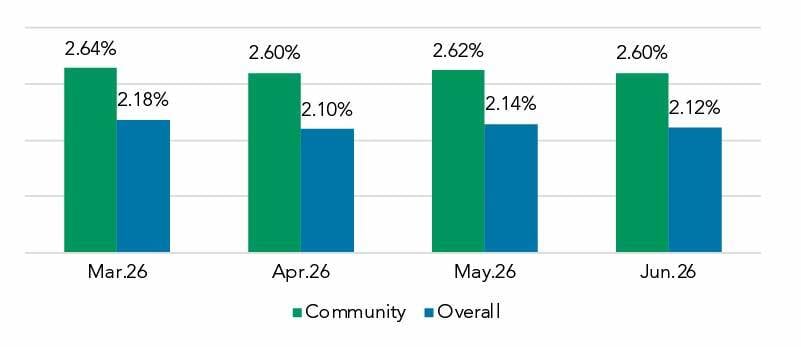
SOFR and Prime spreads have held relatively steady for community institutions over the past four months, with SOFR spreads remaining in a tight range (2.60-2.64%) from April to June, ~50 bps higher than the overall market (2.10-2.18%).
Spread to SOFR: Community vs. Overall Market
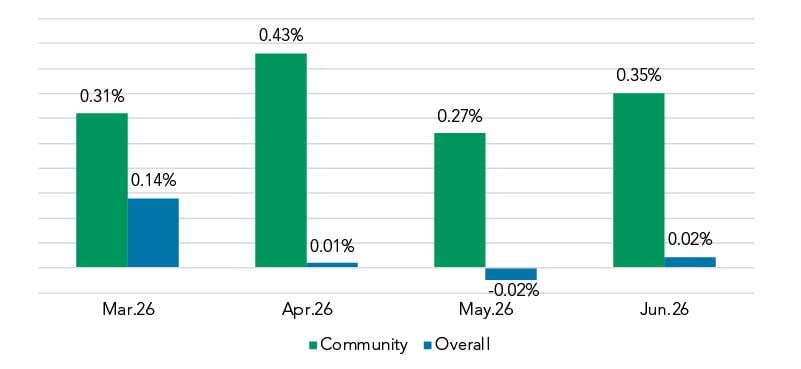
 Prime spreads have been a bit more volatile, rising to 0.43% in April then falling to 0.27% in May, before rebounding to 0.35% in June, but have remained well above Prime spreads in the overall market, which have hovered near 0 the past two months.
Spread to Prime: Community vs. Overall Market
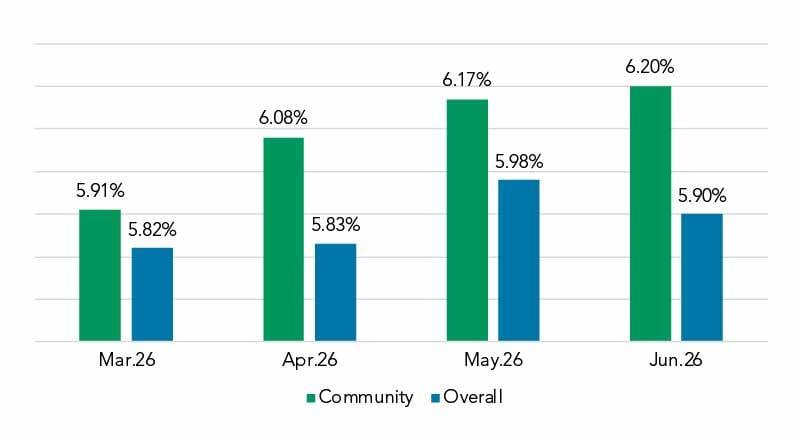
The more notable finding was on the fixed-rate side. Looking across the second quarter, community institutions did a better job holding onto fixed-rate revenue relative to the overall market While larger banks have struggled to bump up fixed-rate coupons as funding costs have risen, the community sector has steadily increased this revenue metric, from 5.91% in April to 6.20% in June.
Fixed-Rate Coupon: Community vs. Overall Market
Got questions?
Our banking consultants and data scientists are combing through Q2 PrecisionLender pricing data every day. If there is anything you would like to know about what they are seeing, please send your questions to insights@q2.com.