22 Sep, 2026

Our September analysis of the Q2 PrecisionLender commercial loan and deposit pricing database looks at August 2026 activity, when pricing volume pulled back sharply after several months of increases. The decline showed up across segments rather than in one corner of the market.
Underneath that pullback, funding and liquidity costs kept climbing, and fixed-rate and SOFR net interest margin moved into near parity after diverging for most of the year. Deposit rates, meanwhile, stayed close to where they've been for months.
Read on for more details.
Data Notes
- When we discuss the cost of funds (COF) on loan pricing activity, we refer to the marginal, duration-matched funding cost employed in pricing, not the bank’s actual average (historical) cost of funds.
- We define Regional+ as institutions with $8B+ in assets, while Community are <$8B.
Volume: Sharp pullback, no signal on shift in banker selectivity
August pricing activity fell about 10% from July, using dollar volume indexed to January 2026. The decline showed up across segments rather than concentrated in one part of the market. We found no evidence that banks became more selective in what they priced, and no meaningful shift on the revenue side tied to the pullback.
Priced Commercial Loan Volume—Indexed to January 2026=100
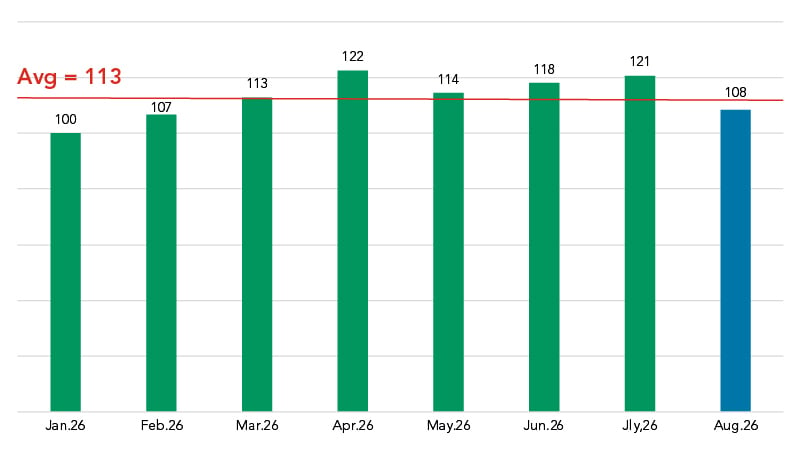
August's reading landed below the year-to-date average on the index, after four straight months at or above it. One explanation is emerging softer borrower demand, which we will monitor in the coming months.
Spreads: Flat across the board
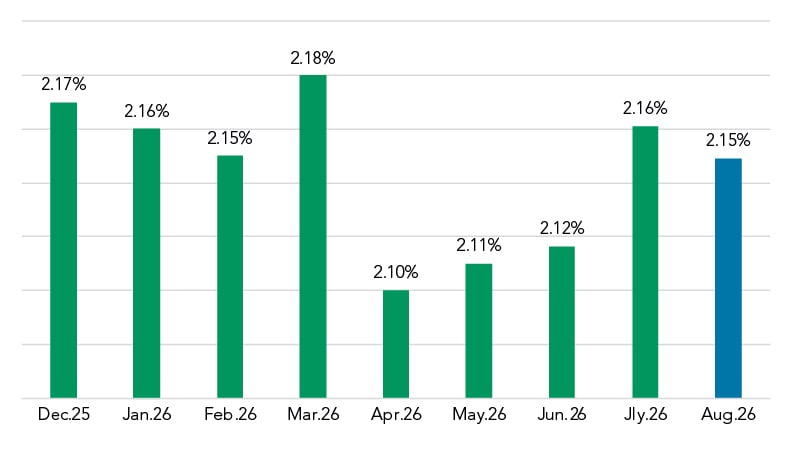
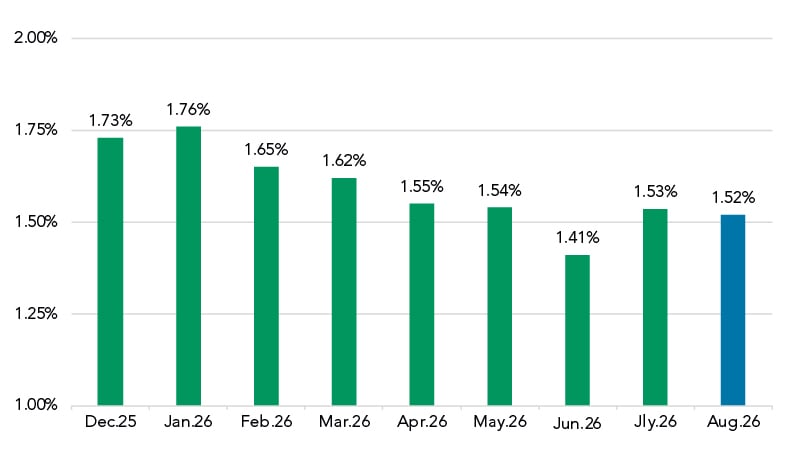
Lower volume did not translate into higher revenue spreads. The SOFR spread to index and the fixed-rate spread over cost of funds each slipped about 1 bp, essentially unchanged from July. The Prime spread moved lower by 6 bps, more than the other two, to +1 bps to Prime. Volume representation mix is about 70% SOFR, 20% fixed and 10% Prime.
Weighted Average Spread to SOFR
Fixed-Rate Spread Over COF
Coupon: Fixed edges higher, SOFR pulls back
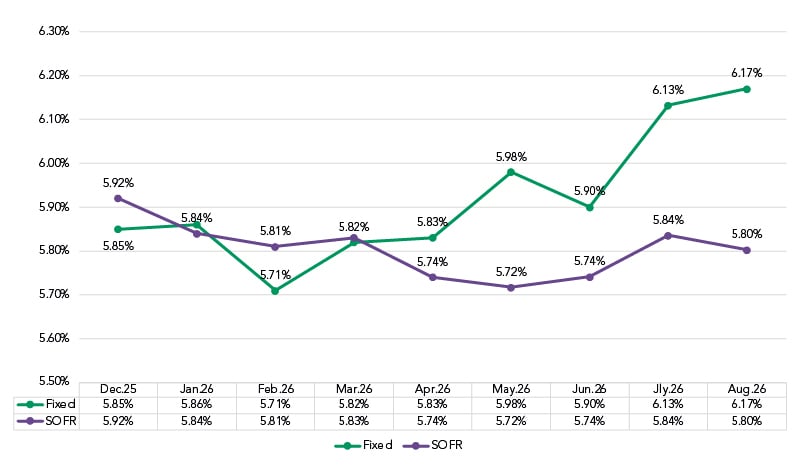
The fixed-rate coupon rose about 4 bps to 6.17%, the second straight month above 6% after a long stretch below that level. The SOFR coupon fell about 4 bps to 5.80%, even though the SOFR spread held flat. The Prime coupon fell about 6 bps, tracking the drop in the Prime spread. We’ve posted two views of coupon trends. The Fixed vs SOFR chart demonstrates the shift since parity in March 2026 moving higher by nearly 50 bps on the fixed rate side and in a tight 10 bps band on the SOFR side.
Coupon Rate by Month—Rolling Trend
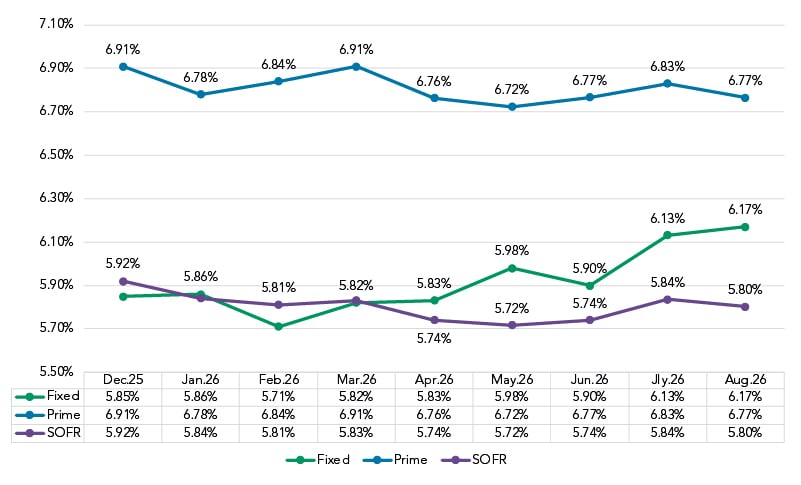
Coupons: Fixed vs. SOFR
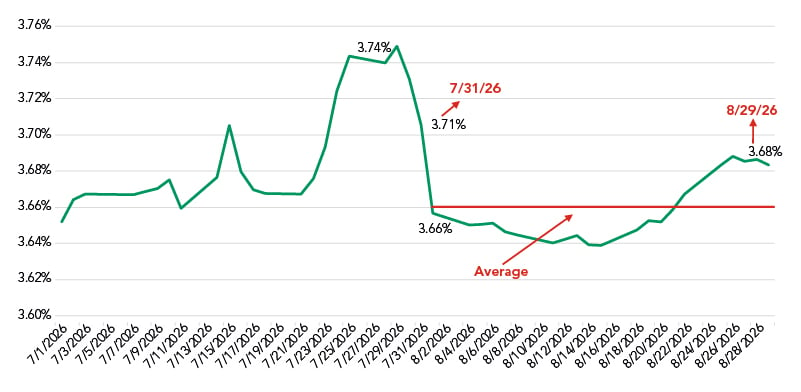
The SOFR coupon moves trace back to the 1-month CME SOFR rate, the index of choice among bankers pricing in Q2 PrecisionLender, that SOFR loans are priced against. We’ve observed index movement intra month and want to show August's daily average for that index was 3.66%, below both the July month-end reading of 3.71% and the August month-end reading of 3.68%. Asa reminder the index value is public facing and is often a separate number from the funding curve banks use to gauge their own costs, which moved higher over the same stretch. That gap between the SOFR revenue driver and floating-rate funding costs has been part of what's kept SOFR NIM tight for most of the year, a point we come back to below.
CME 1 Month July-August 2026
Funding curve: Higher across tenors
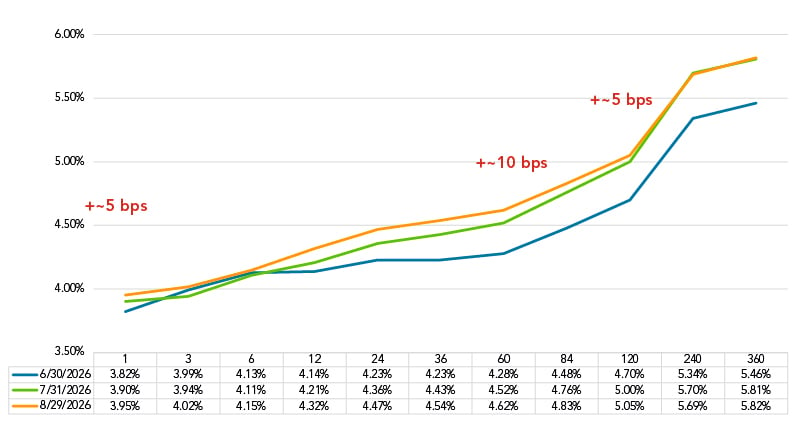
The all-in marginal funding curve moved higher across tenors in August. The 1-month point rose 5 bps to 3.95%, up 13 bps since the end of June. The 60-month point rose 10 bps to 4.62%, up 34 bps since the end of June, the largest cumulative move on the curve. The 120-month point added about 5 bps, to 5.05%.
All-In Marginal Funding Curve
COF: Fixed keeps climbing; SOFR holds
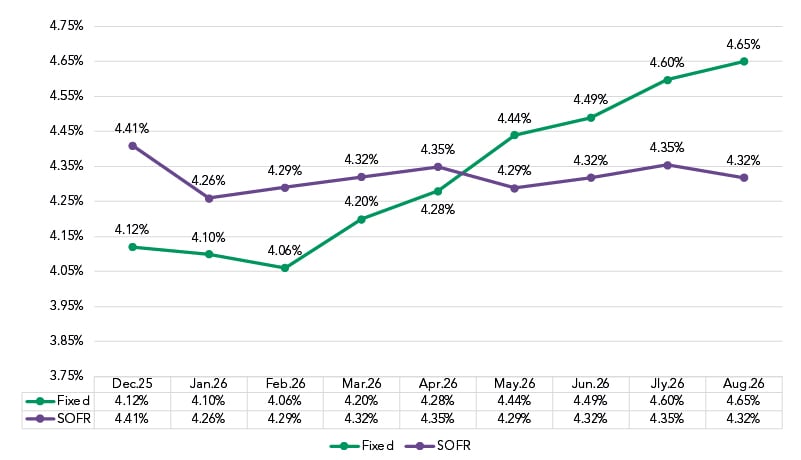
Fixed-rate all-in cost of funds rose about 5 bps to 4.65%, tracking the broader move higher in market rates. That's up roughly 55 bps since the start of the year. SOFR all-in cost of funds fell about 4 bps to 4.32%, staying in the same range it has held for most of the year, near 4.30%.
All-In COF by Month—Rolling Trend
The Federal Reserve raised rates 25 bps in mid-September, confirming the cost pressure that had been building. That move came after the August window covered here, so it isn't reflected in any of the figures above. We'll be watching for its effects in next month's numbers.
Liquidity costs: Still elevated, no easing
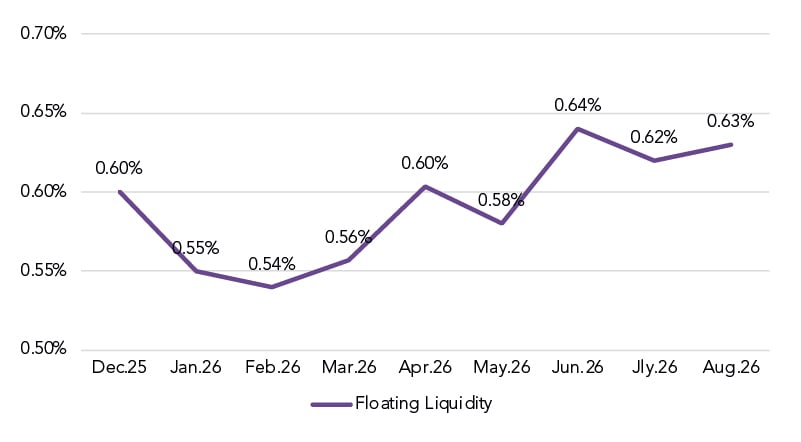
Floating-rate liquidity costs stayed near the high end of their recent range, ticking up to 0.63% from 0.62%. We haven't seen any signs of easing there.
Approximate Liquidity Cost—Rolling Trend
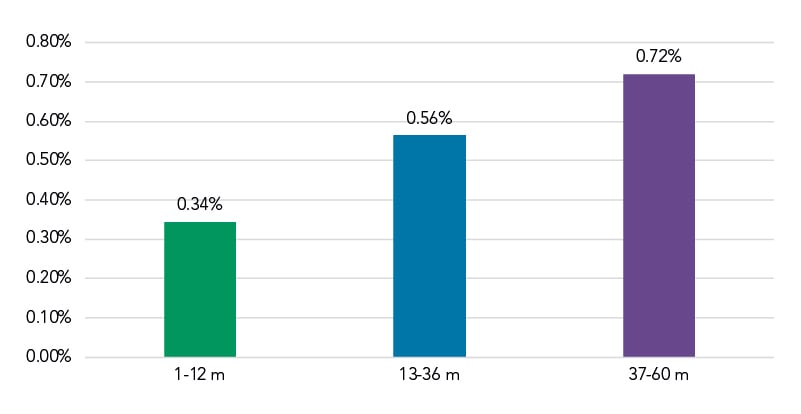
A refreshed view of liquidity costs by loan maturity, covering institutions that use an explicit liquidity curve, shows the curve sloping up from about 0.34% at the short end (1 to 12 months) to 0.72% at the long end (37 to 60 months), a difference of roughly 38 bps. That shape has changed little over the past 90 days. Flat deposit costs, discussed below, are consistent with that ongoing pressure.
Implied Liquidity Cost by Loan Maturity Stratification
NIM: Fixed and SOFR converge
NIM held essentially flat overall in August. SOFR NIM rose about 2 bps to 1.80%, and fixed-rate NIM fell about 2 bps to 1.82%. On a month-over-month basis, bankers largely kept pace with their costs.
Net Interest Margin by Month—Rolling Trend
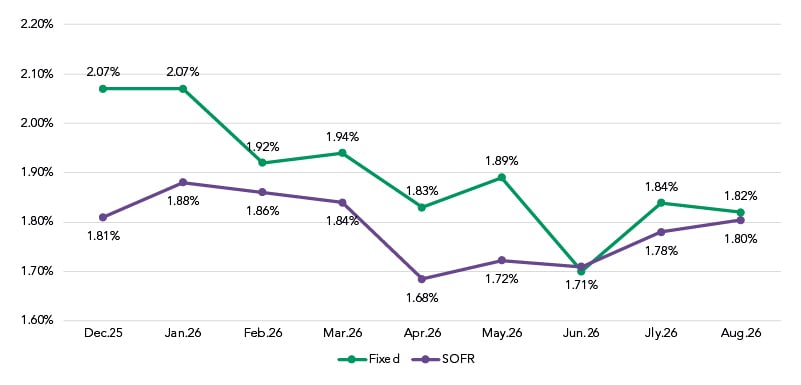
The bigger move is over a longer stretch. The gap between fixed and SOFR NIM was 26 bps at the end of 2025. By August, it had closed to about 2 bps. Most of that closing came from fixed-rate NIM, which is down 25 bps since the start of the year, from 2.07% to 1.82%. SOFR NIM has stayed closer to flat over that same period, down about 1 bp, from 1.81% to 1.80%, consistent with the separation between the SOFR revenue driver and floating-rate funding costs noted above.
Deposits: Rates stalled
Deposit rates paid remain stalled, neither rising nor falling in any meaningful way. Community rates paid ticked down about 1 bp to 2.02%. Regional+ rates paid were flat at 2.65%.
Interest-Bearing Non-Time (MMDA, CWI, Savings) Rate Paid
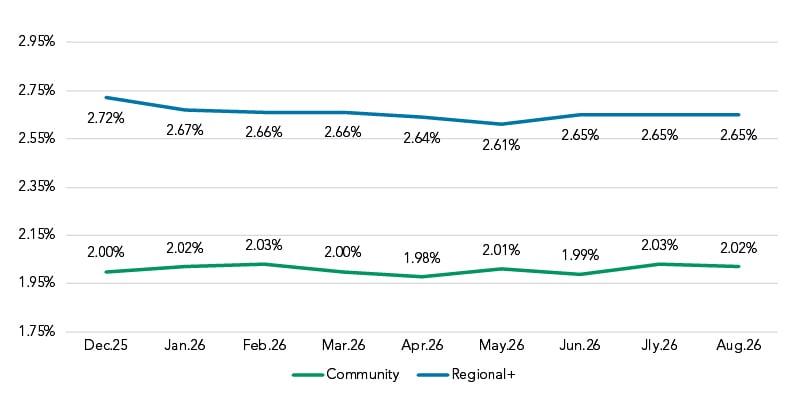
Rising wholesale funding costs would typically push banks to pay more for deposits to bring in cheaper funding. That hasn't happened yet. We'll be watching for any change.
What we'll be watching for in future updates
- The Fed's September move: The Fed raised rates 25 bps in mid-September, after this update's data window closed. Next month's numbers will give the first read on how coupons and spreads respond
- Deposit pricing: Rates paid have been stalled for months against a backdrop of rising wholesale costs, and we're watching for any pivot
- Volume: August's pullback was the first meaningful decline in a while. We're watching whether it continues, reverses, or turns out to be a one-month move
Got questions?
Our banking consultants and data scientists are combing through Q2 PrecisionLender pricing data every day. If there is anything you'd like to know about what they're seeing, please send your questions to insights@q2.com.