26 May, 2026

- When we discuss the cost of funds (COF) on loan pricing activity, we refer to the marginal, duration-matched funding cost employed in pricing, not the bank’s actual average (historical) cost of funds.
- We define Regional+ as institutions with $8B+ in assets, while Community are <$8B.
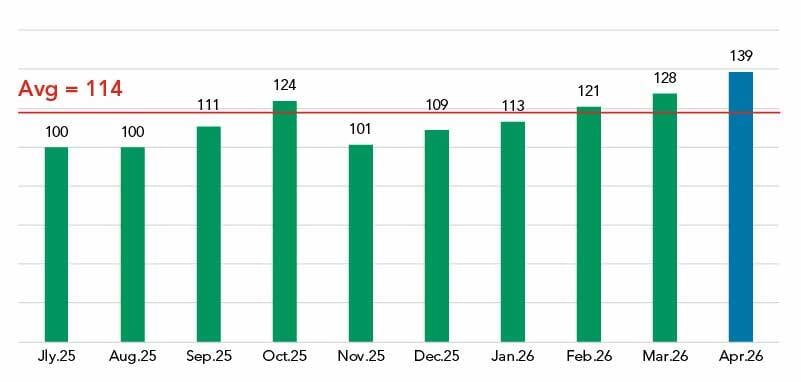
Volume: Strong again, with Regional+ carrying the load
Coupon: Fixed rate overtakes SOFR for the first time since 2022
The coupon picture in April was unusual. The trend since November has been a gradual convergence of fixed and SOFR coupon rates. In April, the fixed-rate coupon moved 9 bps above the SOFR coupon (5.83% to 5.74%). That’s a 48-bps swing since November 2025. The last time the fixed-rate coupon was consistently higher than the SOFR coupon was the third quarter of 2022.
Rolling Trend
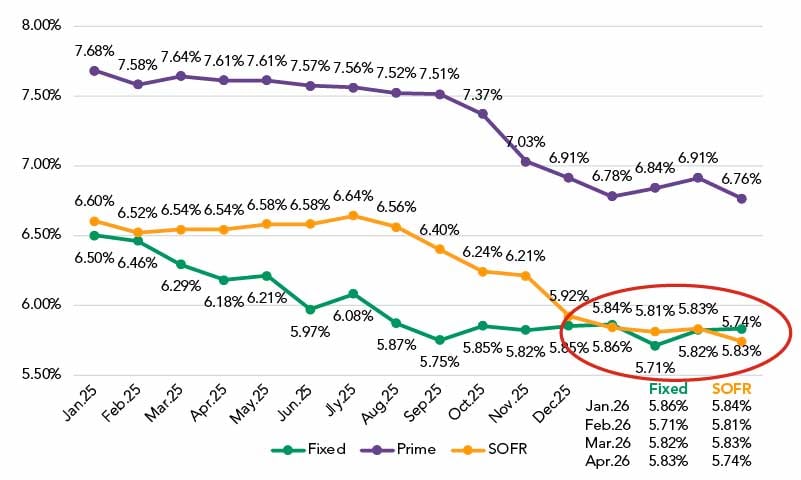
It’s worth noting also that fixed coupons didn’t move higher; they were essentially flat. Instead, the SOFR coupon fell as floating-rate spreads narrowed and the SOFR index itself dipped a few basis points.
With the funding curve continuing to steepen, the question going forward is whether fixed-rate coupons begin to reflect the new cost reality.
NIM: A sharp drop on both structures
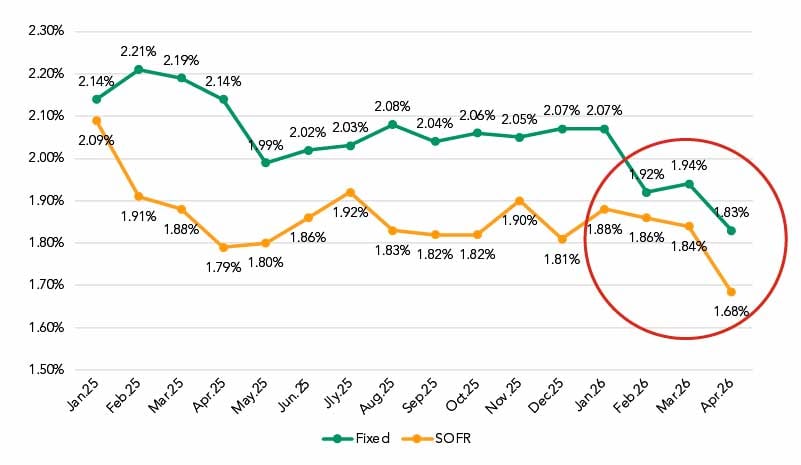
Net interest margin fell sharply in April across both floating- and fixed-rate structures.
SOFR NIM fell 16 bps (1.84% to 1.68%), the product of an 8-bps narrowing in spreads, and a 3 bps increase in SOFR funding costs and a decline in the SOFR index.
Fixed-rate NIM fell 11 bps to1.83%. There, the story was an 8 bps increase in fixed-rate funding costs combined with a flat coupon (+1 bps) and a 4 bps decrease in fee income.
NIM by Month
Rolling Trend
A note on interpretation: the COF figures cited here reflect the marginal, duration-matched wholesale cost of funds used in pricing, not the historical, average deposit-funded cost of funds on a bank’s balance sheet. Actual NIM at the institution level will vary based on each bank’s specific funding mix. Still, the trend in pricing-level NIM reflects the margin pressure bankers are navigating in new and repriced deals.
Spreads: No signs of resilience
Turning to the key revenue indicator, there were no signs of resilience in April.
SOFR spreads narrowed by 8 bps on the month. Prime spreads dropped 13 bps, down to 1 bp over the index.
Weighted Average Spread to SOFR
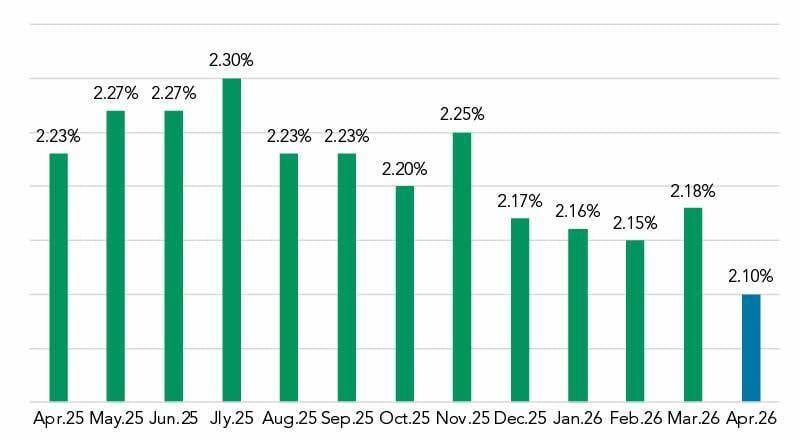
The fixed-rate coupon over COF fell by 7 bps in April, down to 1.55%. This metric is down 21 bps since January.
Fixed-Rate Coupon Over COF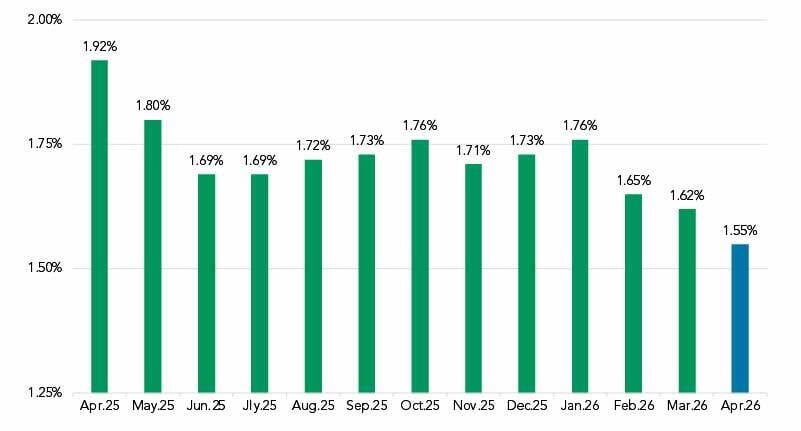
A quick recap: Volume was strong, funding pressure rose, spreads narrowed further. It will be worth watching how these dynamics shift to support borrower needs, banker activity, and pricing manager goals.
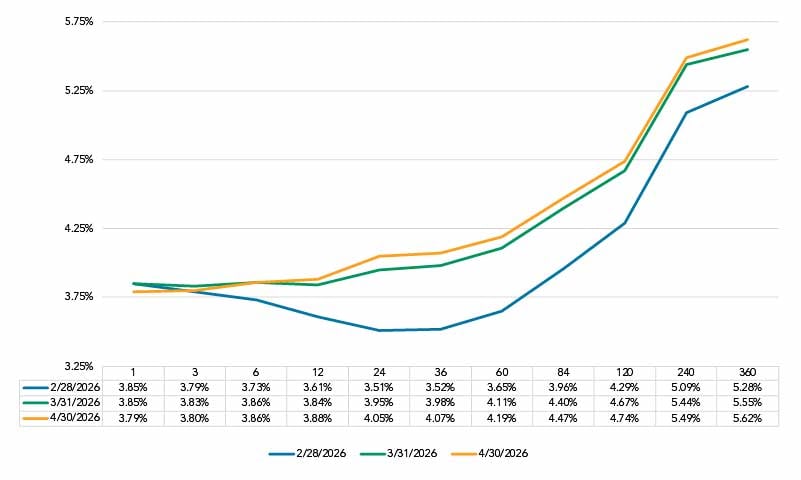
Funding curve: Steepening continues, a classic shape returns
The PrecisionLender all-in marginal funding curve added more slope from the March 31 to April 30 snapshots. The 1-month rate moved down approximately 6 bps, the first meaningful decline in that tenor in some time, while the 24-month point rose 10 bps. The result is a curve that increasingly resembles a traditional, positively sloped shape.
PrecisionLender All-In Marginal Funding Curve
Cost of funds: Rising across all structures, with liquidity adding to the pressure
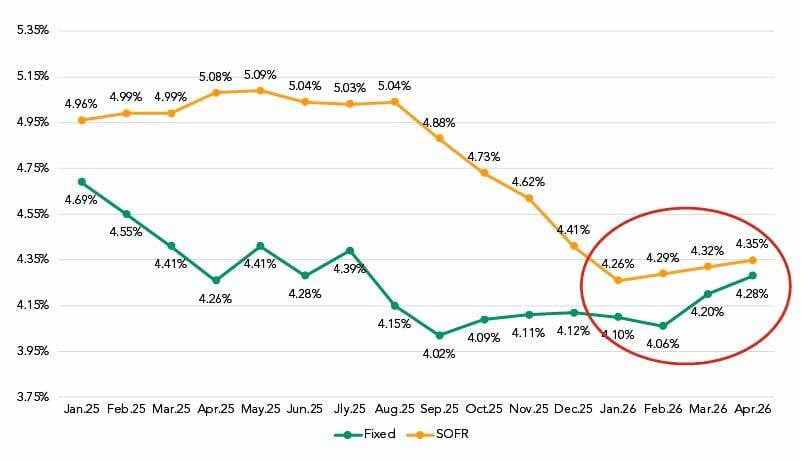
The year-to-date trend on all-in COF is higher across loan structures. SOFR funding costs rose 3 bps in April, while fixed-rate funding costs rose 8 bps. Both measures have trended up throughout 2026, but fixed-rate costs are rising faster. In April 2025, SOFR COF was 82 bps higher than fixed COF (5.08% to 4.26%) that gap has dwindled to just 7 bps a year later (4.35% to 4.28%).
All-In COF by Month
Rolling Trend
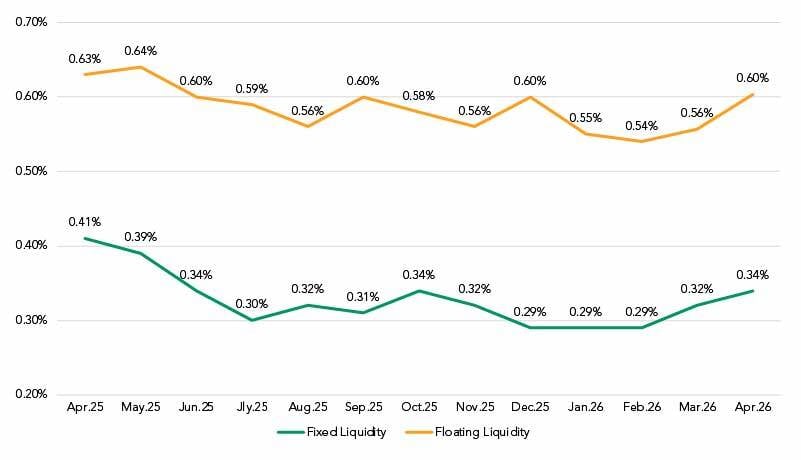
Liquidity costs contributed to the increase in COF as well, moving modestly higher over the past two months on both floating and fixed structures.
Approximate Liquidity Cost
Rolling Trend
The combination of a steepening curve and rising liquidity costs, along with coupon rates that are not keeping pace with those increases, has had a predictable impact on margins.
Deposits: Rates nearly flat, balances not growing
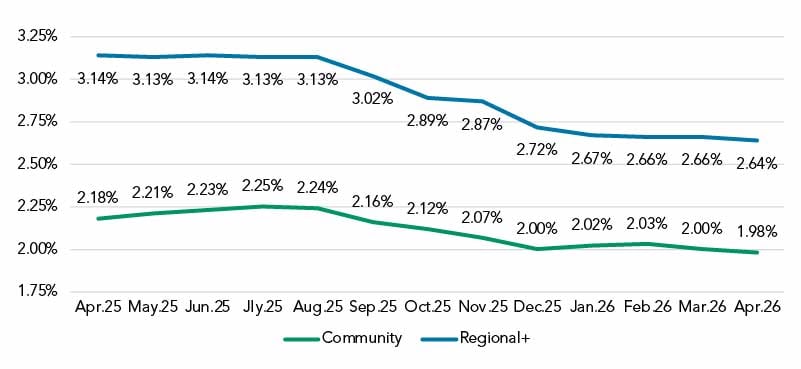
With the rising funding costs in the wholesale market, we checked in to see if bankers were taking steps to secure more deposit funding. We found little movement on deposit rates in April. Interest-bearing non-time deposit rates, a useful proxy for management-set deposit pricing decisions, were down 2 bps in both the Regional+ segment (2.64%) and Community segment (1.98%).
Interest Bearing Non-Time (MMDA, CWI, Savings) Rate Paid
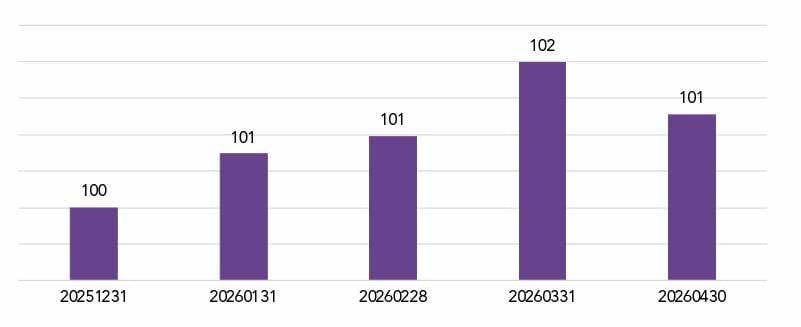
We also looked at portfolio balances and noted that deposit levels, in aggregate, have not grown in step with the sustained increase in loan pricing activity. Indexed to December 2025, Community deposit portfolio balances are up approximately 8% year-to-date, while Regional+ balances are roughly flat. Institutions may need to rely more on wholesale funding to support new loan pricing activity. This could have implications for NIM if these higher-cost resources are employed.
Deposit Portfolio Balances
Indexed to December 2025 = 100
Deposit pricing managers now face a different environment than the one they navigated during the flat and inverted curve period. With a positively sloped curve re-established, the relative advantage of deposit funding over wholesale alternatives is amplified. How banks choose to act on that, both in the rates they offer and the balances they pursue, will be one of the stories we’ll continue to watch in the months ahead.
Got questions?
Our banking consultants and data scientists are combing through Q2 PrecisionLender pricing data every day. If there is anything you’d like to know about what they’re seeing, please send your questions to insights@q2.com.